- NextJS
- Plaid API
- ThreeJS
- Payments
- Data visualisation
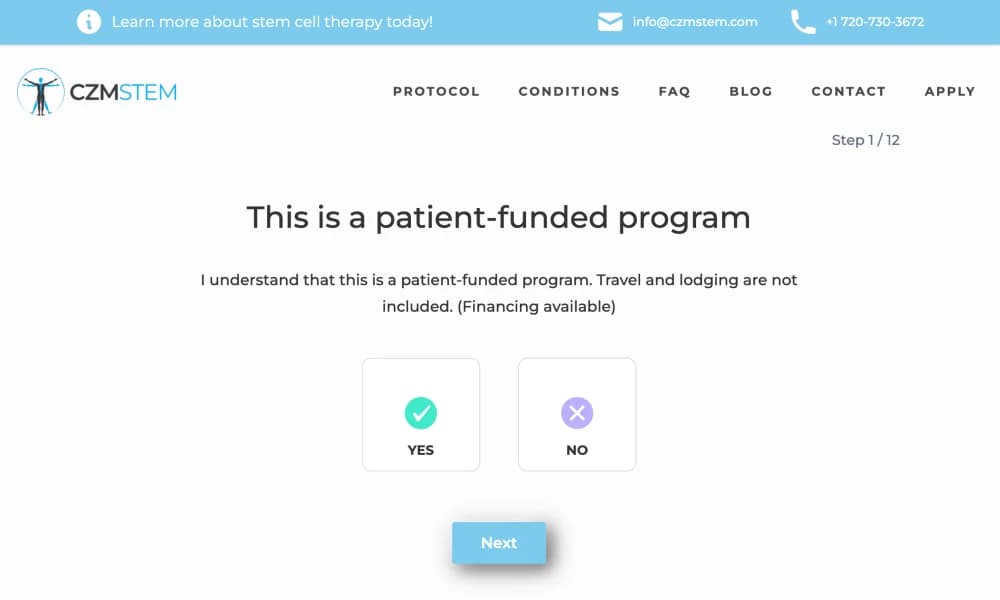
App for a stem cell clinic with user management, payments and health data visualisation.
Features
- User management: Roles and accounts for staff and patients within the clinic workflow.
- Payments: Integrated payment flows aligned with treatment and services.
- Health data visualisation: Charts and 3D views to communicate progress and metrics (see ThreeJS in the stack).
- Financial data integration: Plaid-backed connections where bank or account context is required for the product.
Architecture
At CZMStem we used JavaScript in a serverless JAM Stack architecture.
-
JAM Stack: "JavaScript, APIs, Markup" - better performance, security and easy scaling if needed
-
JS Framework: NextJS allowing us to have a mix of Server side rendered and Client side rendered pages/components, leveraging the amazing features like Image Optimization and make our architecture future proof.
-
CSS Framework: TailwindCSS - reducing the need to write CSS to an absolute minimum, as Tailwind allows the use of utility classes directly in our HTML markup. It eliminates so many points of failure and accelerates development substantially.
-
Deployment: We chose Vercel for our Deployments and Hosting - built by the creators of NextJS. Integrating seamlessly in our CI pipeline, serverless, fast, distributed - an amazing developer experience.
-
Auth: Using auth0, the enterprise-ready, scalable solution in conjunction with NextJS allowed us to focus on more interesting parts of our business logic and being able to really rely on a working functional authentication and authorization.
-
DB: The choice for MongoDB was based on the schema flexibility and the ease of horizontal scaling if necessary.
Tech Stack
- NextJS: Hybrid SSR/CSR, image optimization, and routing for the clinic app.
- Plaid API: Financial account linking and payment-adjacent data where required.
- ThreeJS: 3D health data visualisation and interactive scenes.
- Payments: End-to-end payment UX integrated with the rest of the stack.
- Data visualisation: Dashboards and charts for clinical and operational metrics.